Over the last two centuries observations of our own solar system have refined our understanding of planet formation within the context of the nebular hypothesis proposed by Kant (1755) and Laplace (1796). In the last decade a revolution has unfolded as precision radial velocity measurements revealed the first exoplanets, and unveiled an unimagined diversity of planetary systems. The core accretion model for planet formation has been severely challenged by these observations, but remains the dominant paradigm. Direct imaging of exoplanet systems, which is now within our grasp, will pose fundamental new challenges to our understanding of the origin and evolution of planetary systems.
GPI will detect exoplanets in the outer regions (a > 5 AU) of the planetary systems of main sequence stars in the solar neighborhood. By probing large semimajor axis separations that are inaccessible to indirect methods, e.g., Doppler techniques, GPI will reveal the zone where the majority of gas giant planets are expected to reside. GPI surveys will:
- Establish directly the occurrence rate of planetary systems;
- Provide critical tests of the core accretion model, including a census of regions where gas giants can only form via gravitational instability;
- Shed light on the origin of hot Jupiters by finding planets that migrated outwards;
- Show whether or not the architecture of our own planetary system, with gas giants located between 5–10 AU is unique.
GPI spatially resolves exoplanets from their parent star and uses an integral field spectrometer to record their spectra at low resolution. About half of GPI detected exoplanets are expected to be cool enough for their atmospheres to contain water clouds. Thus, GPI spectra will provide our first view of the vast terra incognita of cool planetary atmospheres, with temperatures between that of Jupiter and the coolest T dwarfs. GPI may even see the ammonia cloud decks in the coolest exoplanets it detects.
Direct Detection of Exoplanets
In addition to the figure to the left showing a simulated planet detection with GPI, the figures below quantify some of the planet detection statistics with a survey of nearby field stars using GPI.
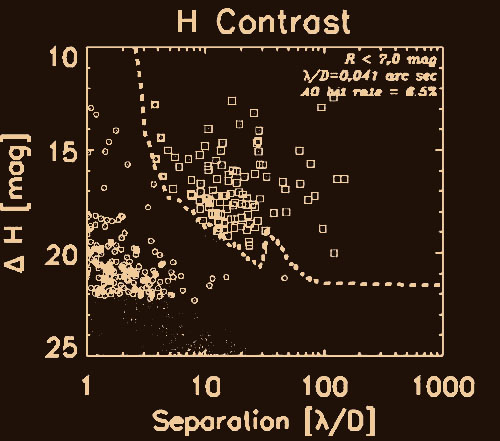
The figure above shows detectable companion contrast versus angular separation for GPI, with the direct detection of young luminous planets in a hypothetical survey of the field stars within 50 pc.The small dots represent the planet population: those detected by GPI are drawn with a box, those detectable in current Doppler surveys are shown with a circle. The dashed line shows the GPI contrast threshold (5-sigma) for a 1-hour exposure at 1.65 micron. Within 100 lambda/D, speckle noise dominates.
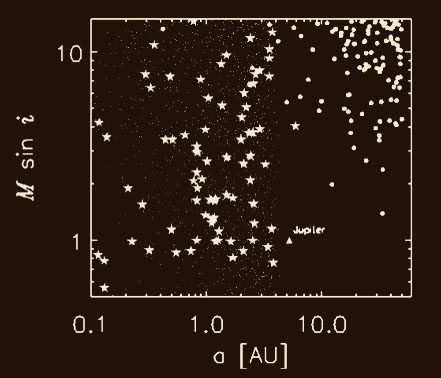
Above, planets detected with GPI are marked with solid filled circles in this plot of planet mass versus semi-major axis. Light dots are planets detected by a hypothetical 8-year astrometric interferometer survey, with a limit of R < 10 mag, and a precision of 30 microarcseconds. Exoplanets detected in the Keck/Lick Doppler survey are shown as stars. This illustrates how GPI explores a complementary phase space to indirect planet searches.
Spectra of Exoplanets
The direct detection of extrasolar planets enables observations of their chemical composition via spectroscopy. The spectrum of a Jupiter reveals the existence of water, ammonia, and methane. The depth and shape of each profile leads to an understanding of the temperature and gravity of planet.
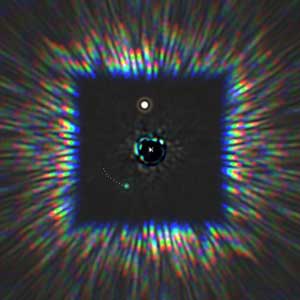
Simulation of a planet detected with GPI. The star is a K spectral type and is 17 pc away. The white object (north) is a background object and the green object below the star is a planet with mass twice that of our Jupiter and with an age of 100 Myr. The white dots near the planet represent the position of the planet relative to the star over 10 years (1 dot/year).
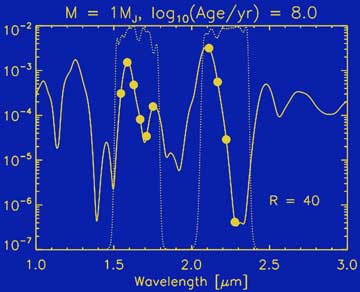
GPI is capable of spectroscopy with R~60 in the near infrared. The solid line shows the spectrum of an extrasolar planet, smoothed to R~40, calculated by Burrows et al. 2003. The dotted line shows the transmission profile through the earth’s atmosphere (higher values represent better transmission). Filled circles represent sample data points from GPI.
